
Dr. Fabio Sasahara
The HCM methodology for Signalized Intersections offers a wide range of calibration parameters. Most traffic signal studies assume default values for these parameters, since field measurement may not always be feasible.
While these defaults provide a reasonable starting point, they were developed from data from multiple sites across the U.S. and may not accurately reflect local driving behavior. As a result, analysts often find that modeled queues, delays, and capacities differ from field observations.
This article highlights the parameters that can be used to calibrate driver behavior in signalized intersections, and how they can be modeled in the Highway Capacity Software (Streets module).
Saturation Flow Rate
If there is one parameter that deserves the most attention, it is the saturation flow rate. The HCM defines saturation flow rate as the rate at which queued vehicles can discharge through an intersection when green time is continuously available. Because signal capacity is directly related to saturation flow rate, even small adjustments can significantly affect delay, queue length, and level of service calculations.
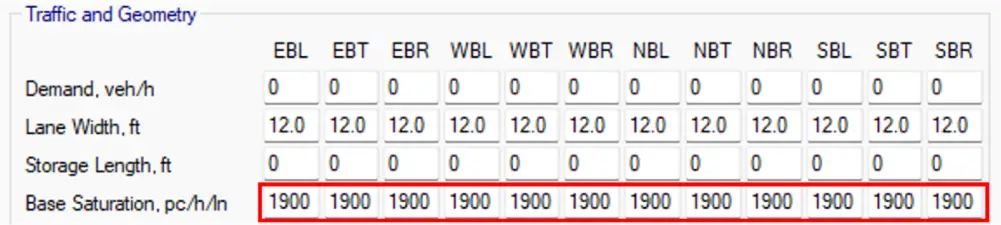
The default value for saturation flow rate is 1,900 pc/h/ln and can be adjusted under the “Traffic and Geometry” page. The HCM also suggests that a base value of 1,750 pc/h/ln may be adopted for locations with a population smaller than 250,000.
For field measurements of saturation flow rate, the Highway Capacity Manual Chapter 31 (Signalized Intersections: Supplemental), Section 5 provides guidance for data collection.
Additional Calibration Factors
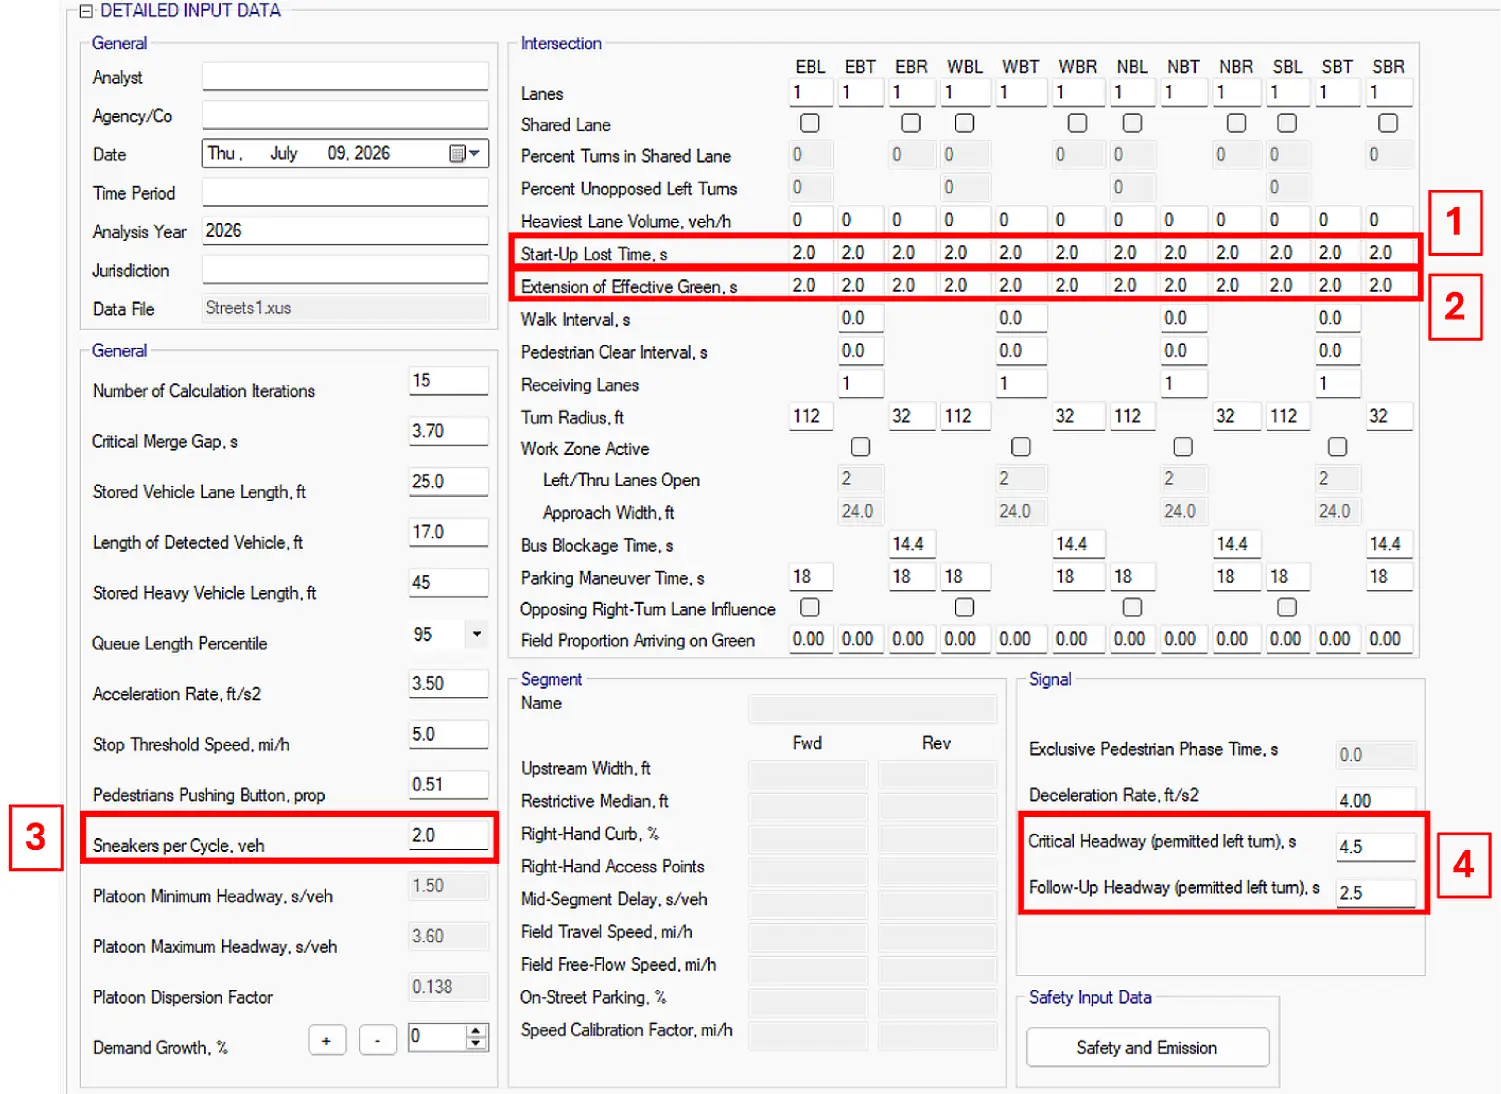
There are other factors that may be modeled for further calibrate driver behavior in a signalized intersection. They can be accessed under the “Detailed Input Data” section in HCS Streets:
1. Start-Up Lost Time
The first few vehicles in a queue take time to react to the green indication and begin accelerating. The HCM recommends a default 2.0 seconds of start-up lost time under typical conditions. Field conditions may differ from the HCM defaults due to, for example: driver distraction, limited visibility, complex intersection geometry or older driver populations.
Additionally, research has found that cellphone usage by drivers sitting in an intersection leads to higher start-up lost times, and consequently reduced capacity. A study from University of Central Florida suggests adopting a start-up lost time of 3.5 s instead of the default 2.0 s recommended by the HCM to account for driver distraction.
Impact on models: increasing start-up lost time reduces capacity for a specific lane group
2. Extension of Effective Green
This parameter represents the last portion of the yellow interval not used by drivers to advance into the intersection, with the HCM suggesting a default value of 2.0 seconds.
However, not all drivers respond to the yellow indication the same way. Conservative drivers may begin braking as soon as the signal changes, while aggressive drivers may continue through the intersection through the entire yellow interval. For the latter case, a value of zero in this parameter would better represent local conditions.
Impact on models: reducing the extension of effective green increases capacity for a specific lane group
2. Extension of Effective Green
This parameter represents the last portion of the yellow interval not used by drivers to advance into the intersection, with the HCM suggesting a default value of 2.0 seconds.
However, not all drivers respond to the yellow indication the same way. Conservative drivers may begin braking as soon as the signal changes, while aggressive drivers may continue through the intersection through the entire yellow interval. For the latter case, a value of zero in this parameter would better represent local conditions.
Impact on models: reducing the extension of effective green increases capacity for a specific lane group
3. Sneakers per Cycle
At many intersections, one or two additional left-turning vehicles complete their movement at the end of the yellow interval after opposing traffic stops. These “sneaker” vehicles can significantly affect permissive left-turn capacity. The default HCM value is 2 sneakers per cycle for permitted left turns. If field observations consistently show sneaker vehicles, the model should account for them.
Impact on models: Sneakers affect the capacity of left-turn movements operating under protected-permissive or permissive-only phasing. Increasing the number of sneakers increases the capacity of permitted left turns.
4. Gap-Acceptance Parameters – Permitted Left Turns
Gap acceptance parameters are critical when analyzing permitted left turns. In this type of operation, left-turning drivers must find gaps in the opposing traffic stream to advance into the intersection.
For permitted left turns, the HCM method for signalized intersections is based on two key parameters that represent driver behavior and are also the basis of stop-control intersections and roundabout methodologies:
- Critical headway: The minimum headway in the conflicting traffic stream that will allow a left-turning vehicle to enter the intersection. Vehicles will reject any headway shorter than the critical headway.
- Follow-up headway: The time between the departure of one vehicle from the minor street and the departure of the next vehicle using the same headway.
Measuring critical headways on the field can be challenging (every driver has a different risk tolerance), as it requires observing gaps for multiple drivers, followed by additional statistical modeling. For practical reasons, it is more common to measure follow-up headways in the field for calibration purposes.
Impact on models: Higher headway values represent more conservative drivers and result in reduced capacity for permitted left turns. Conversely, lower headways represent more aggressive drivers, resulting in higher capacities.