Dr. Shen Dong
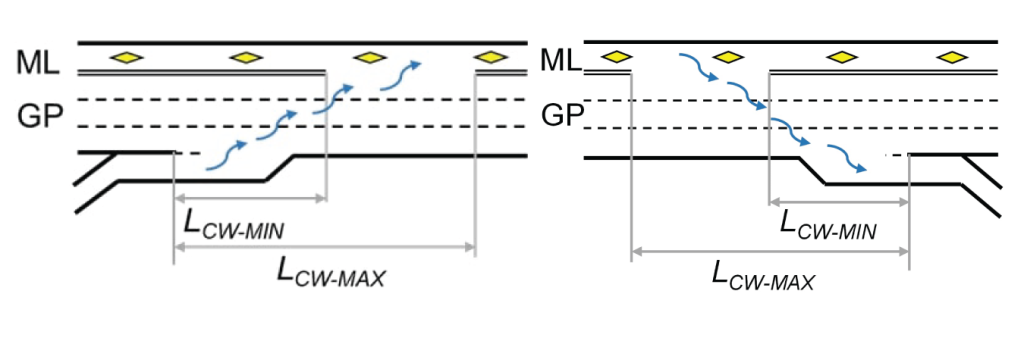
As an extension of the weaving methodology, the Highway Capacity Manual presents methods to calculate the capacity reduction due to cross-weaving movements in freeway facilities. Cross-Weaving movements are defined as vehicle movements between a managed lane (ML), which is on the leftmost lane of the freeway, and the nearby entry or exit ramps. This configuration causes the freeway general purpose lanes (GP) to operate as a weaving segment. The vehicle performance is also sensitive to the availability of road length (LCW) to complete maneuvers.
The definition of the access point location for ML facilities becomes a design decision that affects operations along the facility. Research has shown an optimal access point may exist to maximize the performance of a cross-weave facility[1].
For example, where an on-ramp is followed by an off-ramp, the managed lanes access locations should be adjusted so that both the upstream merge and the downstream diverge have sufficient length to allow vehicles to efficiently move between ramps and access points. This is a trial-and-error process to balance these and find an optimal configuration.
[1] Dong, S., Khanapure, V., Taningco, S., Sampson, B. (2017) Optimize the Location of Managed Lanes Access Segment for Efficient Cross-Weaving in Freeway Facilities, Presented at the 5th Annual UTC Conference for the Southeastern Region, STRIDE, University of Florida, Gainesville, FL.
The HCS Freeways module can be used to find the optimal location for managed lane access points on freeway segments, allowing the engineer to measure the efficiency of cross-weaving movements. As a result, it can be used to provide guidance on the design of managed lane access segments.
By testing values for length LCW (see figure), an optimal design can be proposed to minimize average segment and facility density, resulting in better LOS. Starting from an initial value, new lengths may be tested iteratively until the estimated density reaches desirable, if not optimal, standards.