
Dr. Fabio Sasahara
A traffic study usually involves a high volume of data for inputs and outputs. The quality of a traffic study is just as good as the quality of the data involved, which includes being free of typos and accidental data input errors.
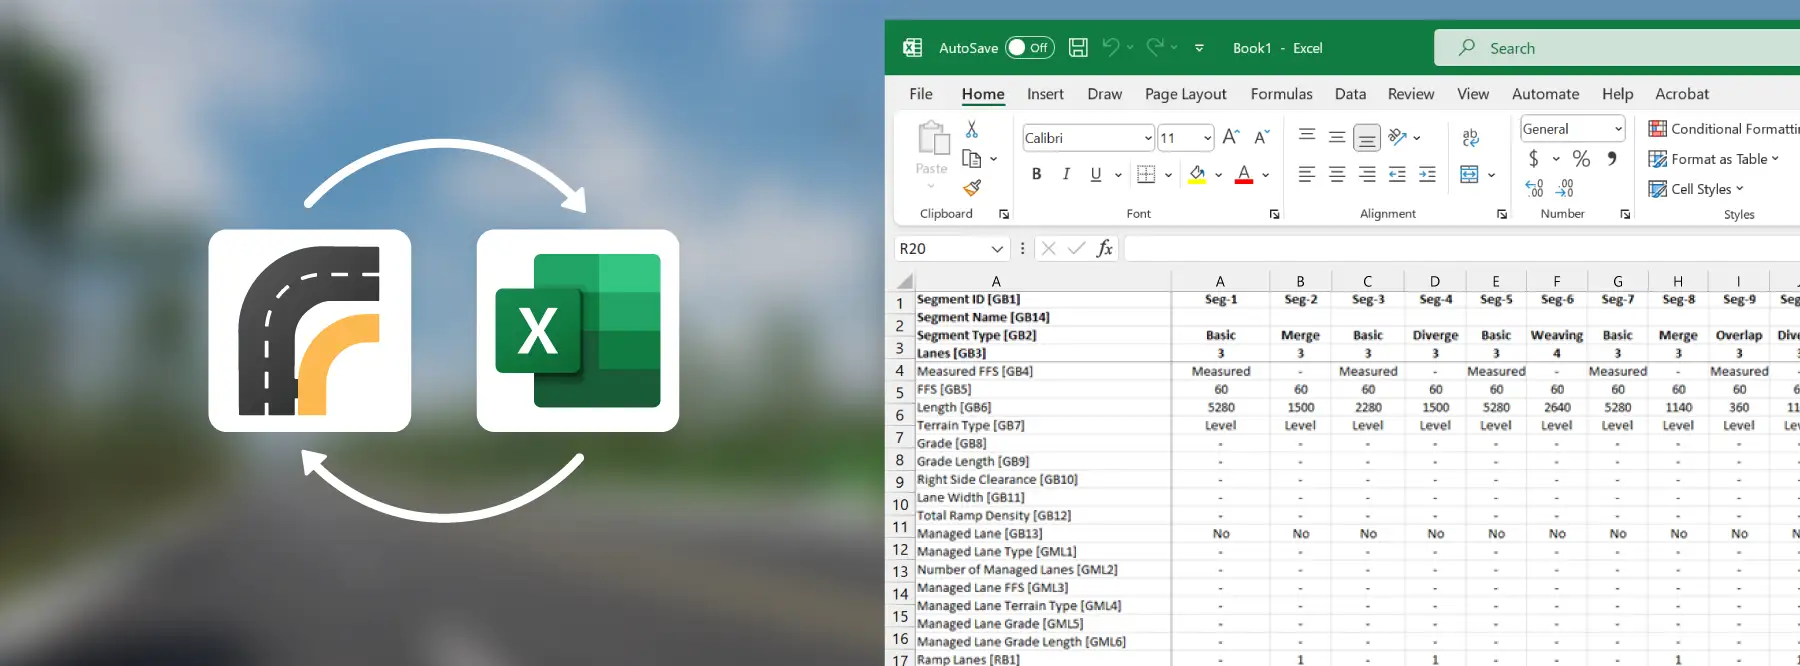
Over the last releases, our team worked hard to implement tools that facilitate the data input and output process in HCS, such as import/export to .CSV files. This feature can be an invaluable tool to streamline your data input/output process to ensure efficient, error-free traffic modeling.
A previous article outlined the process of importing/exporting .CSV files between Streets and Excel for efficient signal analyses. This article will explore the applications of a similar feature for Freeway analyses in HCS.
Freeways to .CSV – How does it work?
In the Freeways module, it is possible to export a facility to a .CSV file, where the most important parameters can be easily editable in a spreadsheet format.
To export a model, select in the Main Menu: Export → Facility → CSV
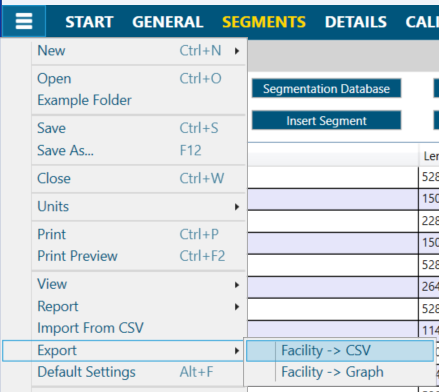
'Export' button in the main menu of the Freeways Module
As a recommended best practice, always define your time-space scope of analysis (i.e. model all freeway segments and analysis periods) before exporting to a CSV file. Every time the scope of analysis is changed, the entire structure of the .CSV file will be changed as well.
A large number of parameters are exported to a spreadsheet, including:
- Freeway geometry: list of segments, segment type, terrain type, free-flow speed, lane configurations, managed lanes, etc
- Special events: weather, incidents, work zones, etc
- Traffic: mainline demand, ramp/weaving demands, % heavy vehicles, PHF, driver population, etc
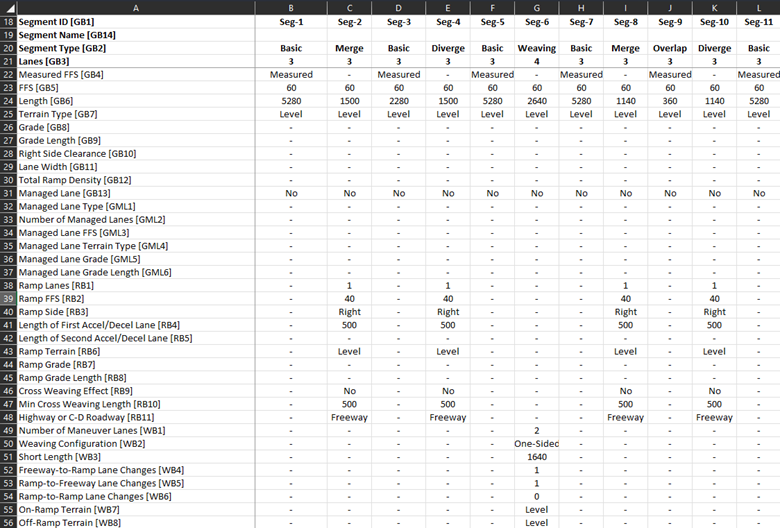
Example of an Excel spreadsheet exported from the Freeway Module
After editing parameters in the spreadsheet, import it back to HCS:
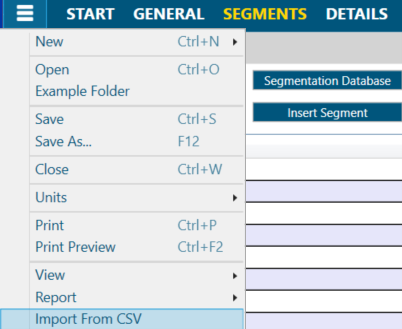
'Import from CSV' button in the main menu of the Freeways Module
A few ideas to apply this features are presented below.
Quickly enter traffic data for longer multi-period analyses
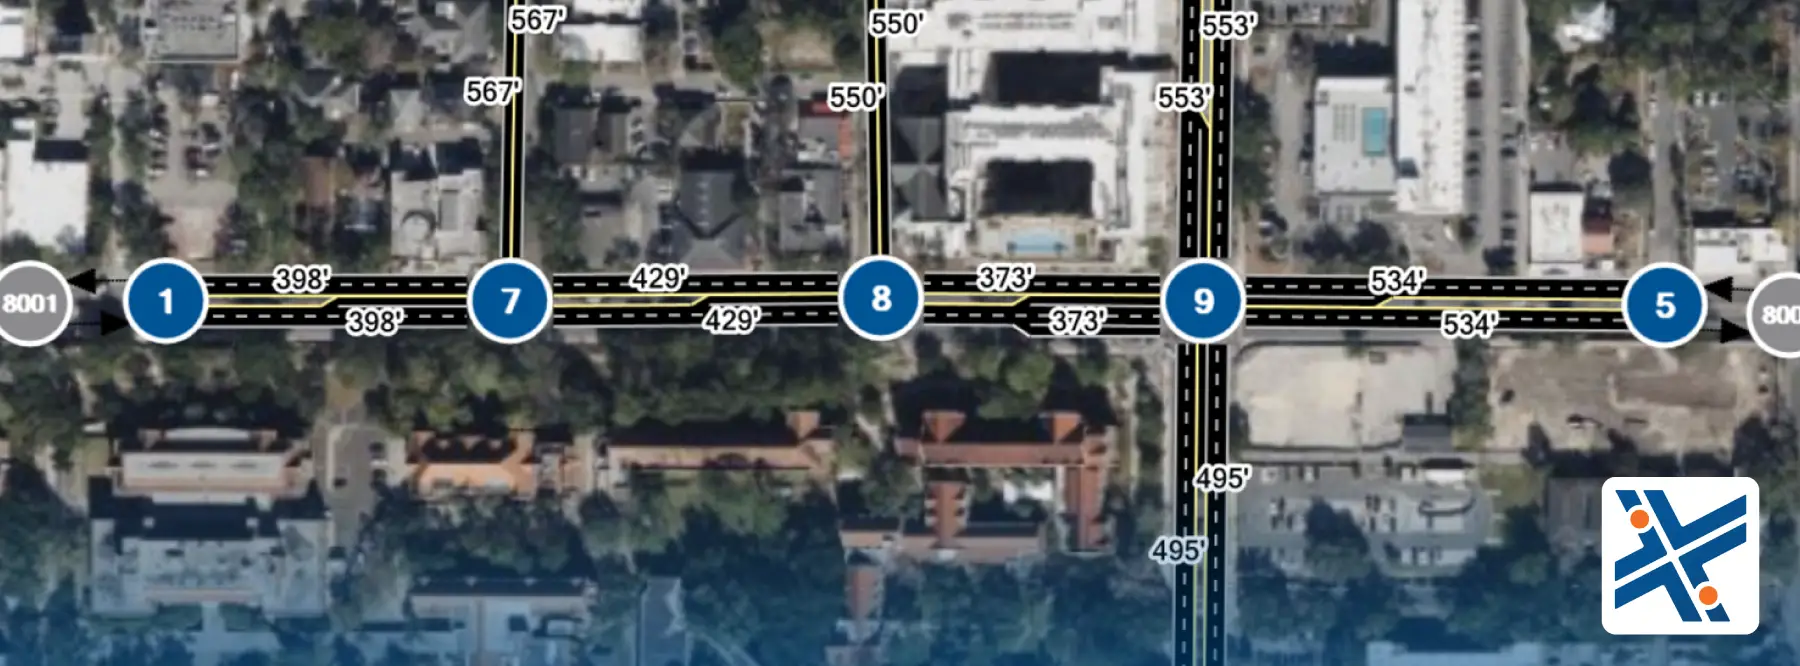
One of the HCM’s main principles for oversaturated freeway analyses is to expand the time-space scope to accommodate all existing congestion. For heavily congested peak hours, it may require the user to model multiple hours of freeway operations as a series of 15-minute analysis periods. (read more here). Manually entering volumes in these scenarios can be a time-consuming task and can be greatly simplified by entering volumes through a spreadsheet
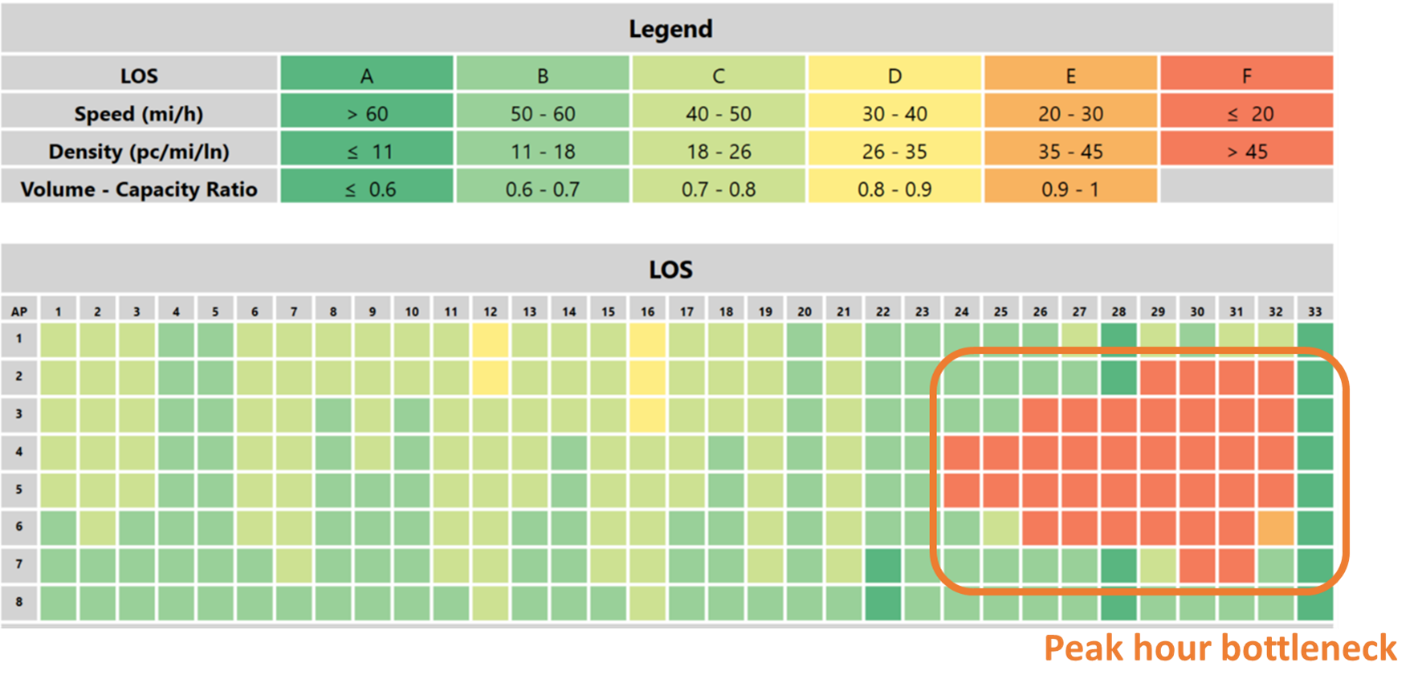
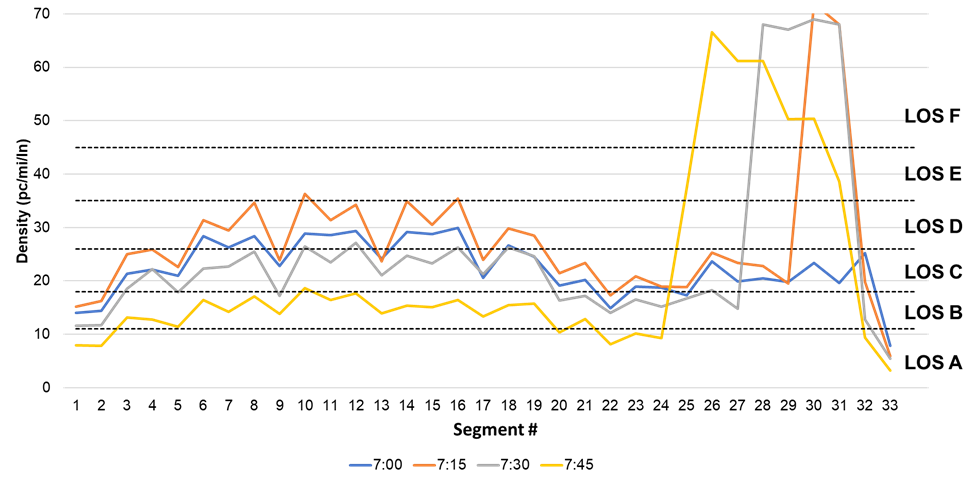
Evaluation of a 33-segment facility over a two-hour peak period congestion
Evaluate multiple scenarios with different parameters
Traffic studies typically evaluate multiple scenarios comprising different time horizons and/or different alternatives. With an exported .CSV file, the user can easily create multiple scenarios and import them back to HCS, such as different future years based on a certain traffic growth forecast:
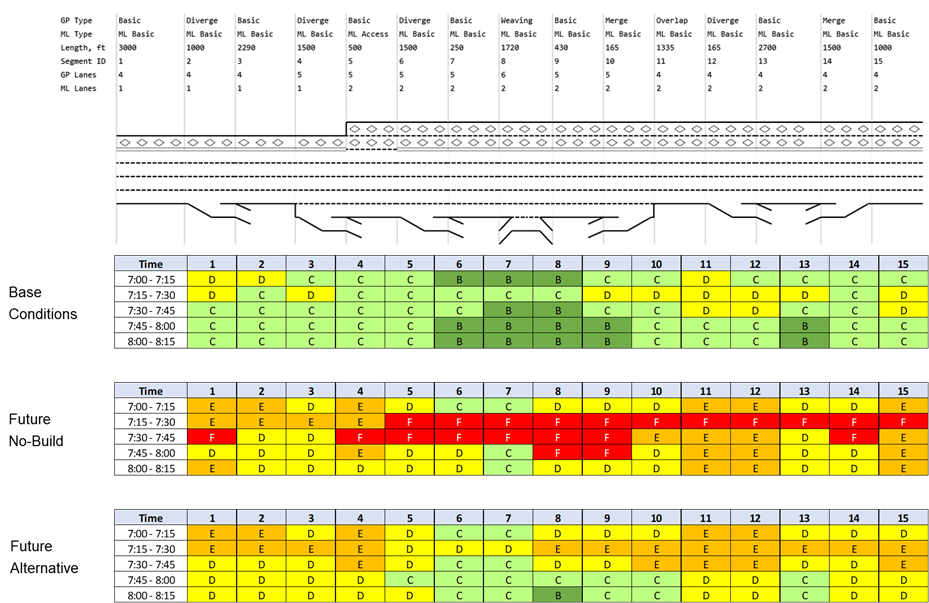
Comparison of multiple scenarios with different demands and treatments
Export performance measures for external reports
Every organization has its own templates and styles for reporting and presenting studies. By exporting the analysis results to a spreadsheet, users can quickly link the results to their templates to produce graphs and dashboards of their preference:
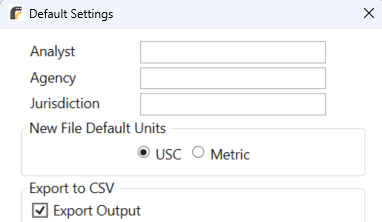
Checkbox to include calculation outputs when exporting to CSV
Custom graphs produced from .CSV export