
Gustavo Zschaber
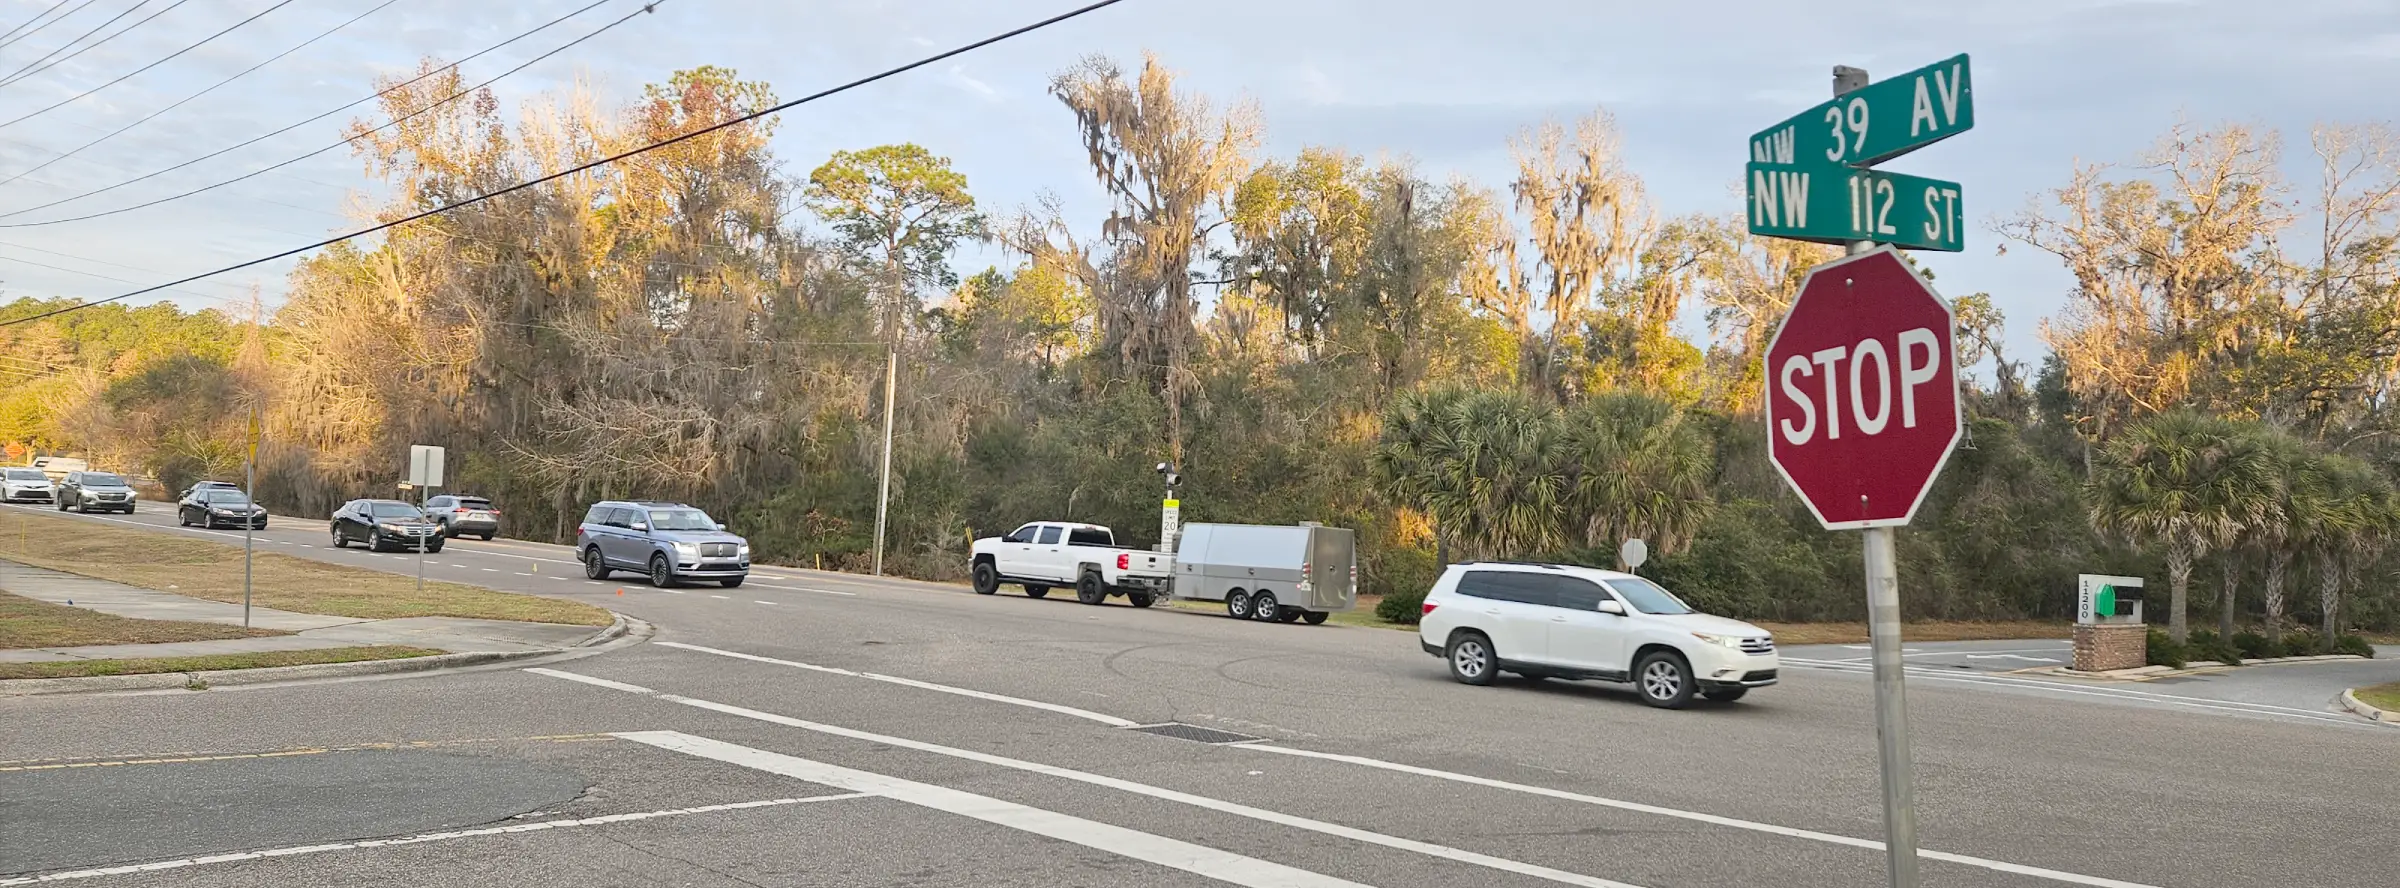
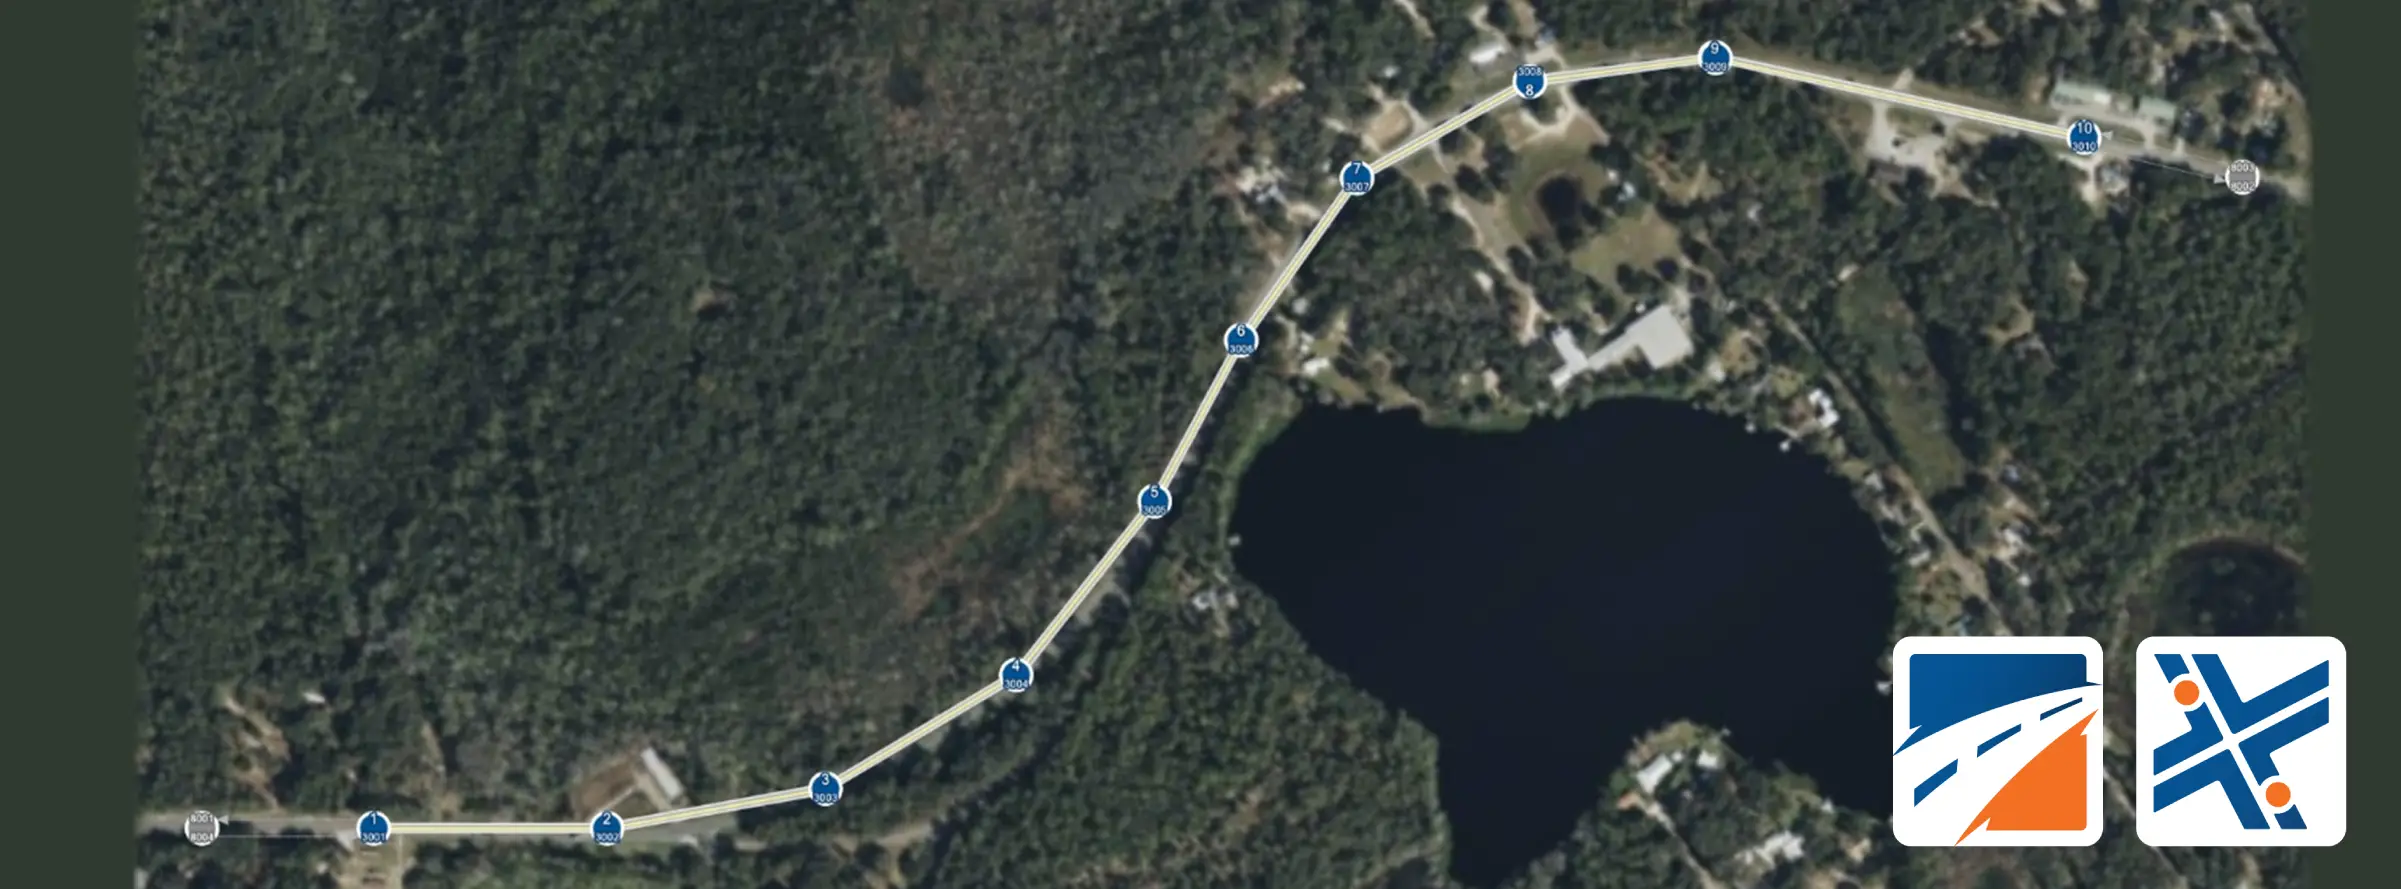
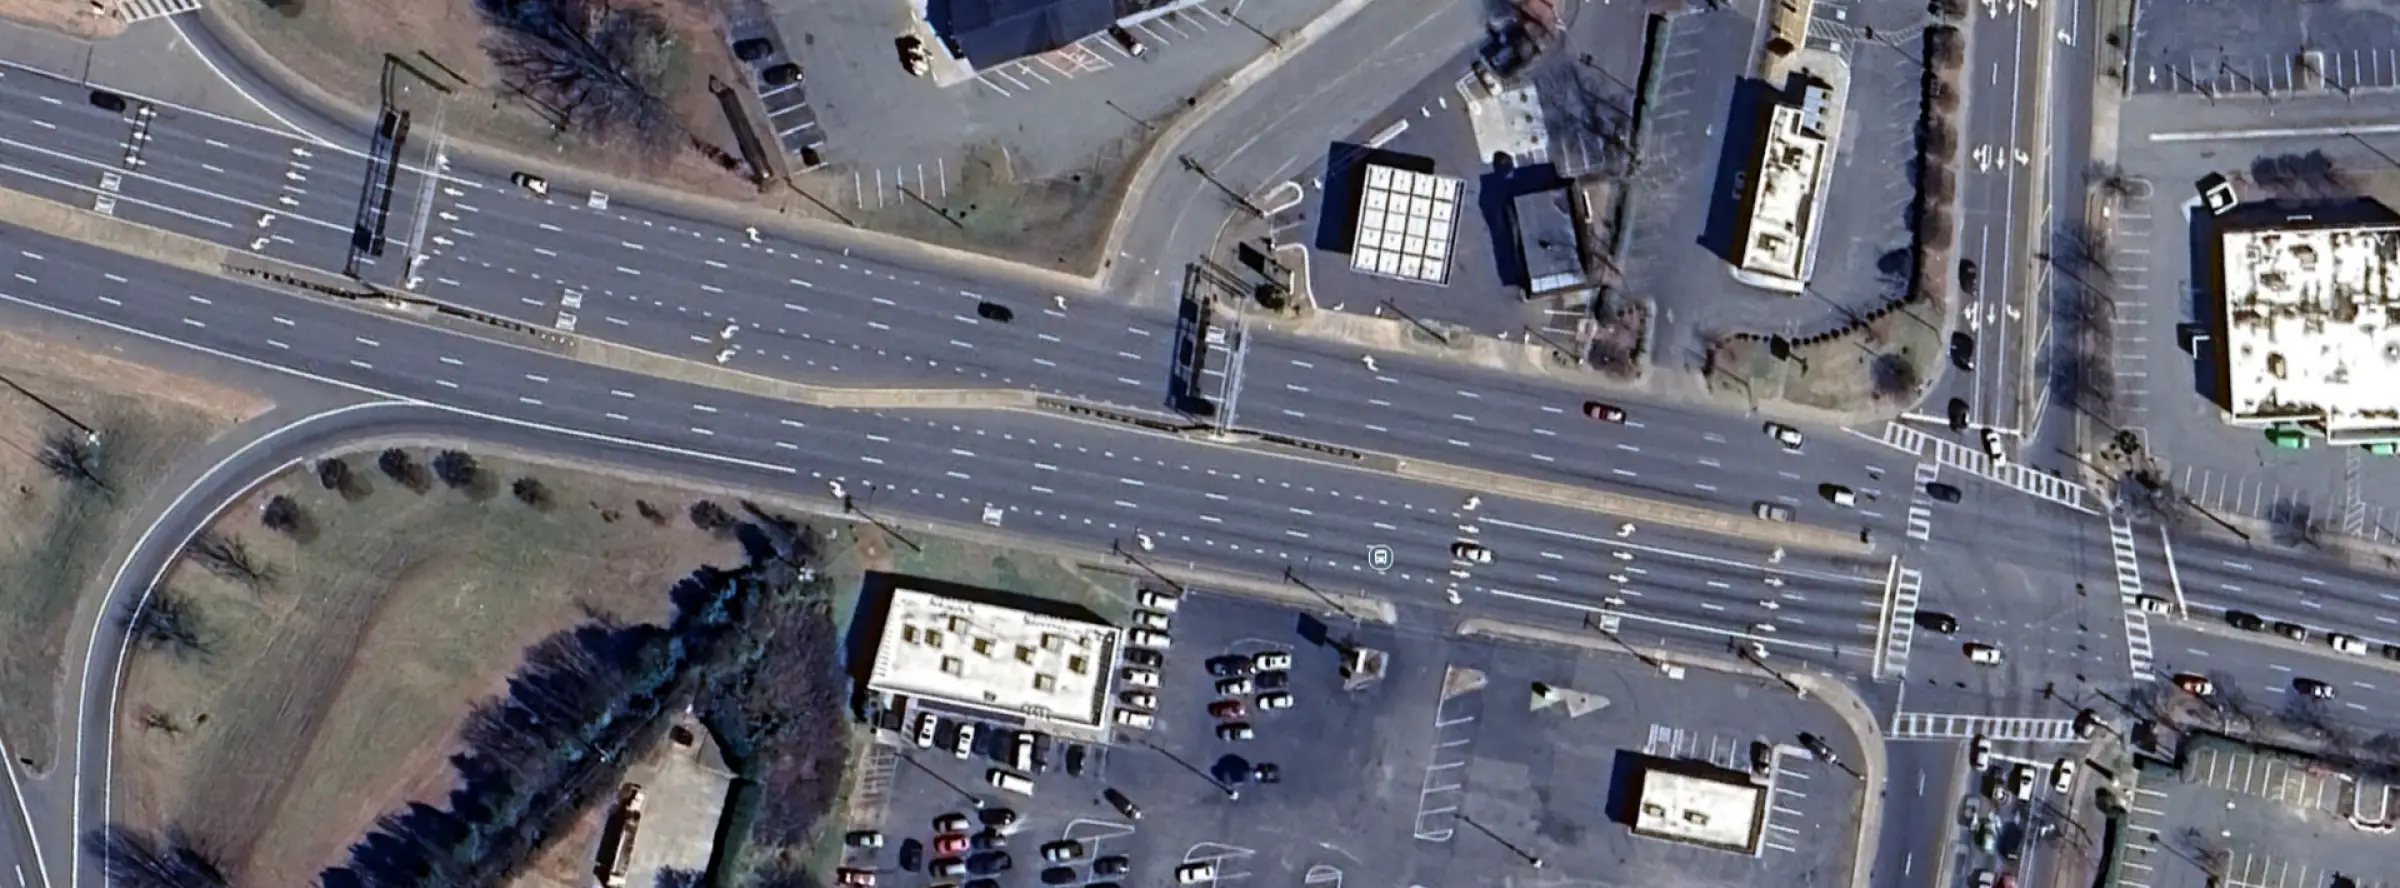
An arterial weaving segment is a portion of an arterial road where multiple traffic streams merge and move in the same direction toward different destinations. These segments are commonly found at interchanges between freeways and arterials but can also occur between two arterial roads. Similarly to freeway weaving, these sections differentiate from basic arterial segments by the frequent lane-changing maneuvers as drivers adjust their positions to reach their intended exits at the downstream intersection. This constant maneuvering creates turbulence within the segment, impacting traffic flow and increasing delays.
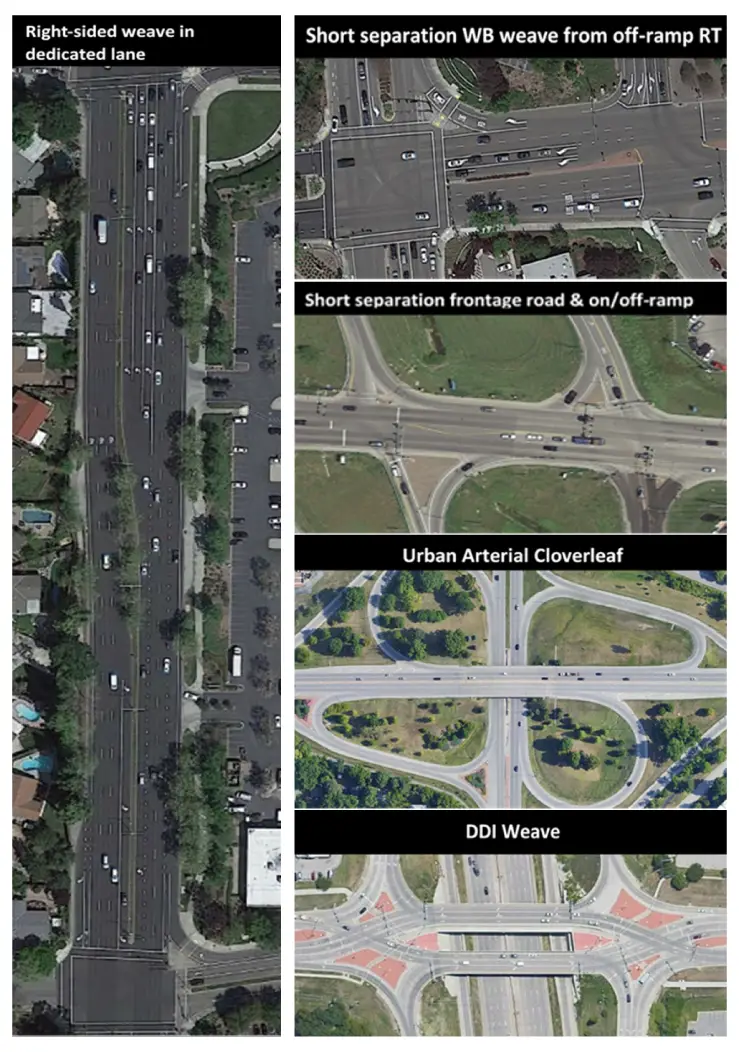
Figure 1: Arterial Weaving Configuration Examples. Source NCHRP Research Report 1094
The Highway Capacity Manual 7th Edition lacks a method to evaluate arterial weaving. The manual offers evaluation methods for arterial segments (Chapter 18), urban facilities (Chapter 16), and freeway weaving (Chapter 13), but does not include an analysis method for arterial weaving segments. With the purpose of filling this gap, a recently published report produced by the NCHRP Research Report 1094 used field and microsimulation data to develop a new methodology for the analysis of arterial weaving. That methodology extended the existing HCM method for urban segments, by estimating an additional delay component to account for weaving.
Additionally, as part of NCHRP Research Report 1094, Kansas University conducted a driving simulator experiment to extract driver behavior parameters in arterial weaving settings. As traffic density increased, drivers showed reduced speeds, accepted shorter gaps, and had lower time-to-collision (TTC), indicating riskier maneuvers. Left-to-right weaving, more through lanes, and older age were associated with slower speeds and lower acceleration. Longer segments allowed higher speeds, and male or younger drivers tended to accelerate more during the maneuver.
Regression models showed that lead and lag gap acceptance decreased with higher density and more complex maneuvers, but lag gaps were longer during left-to-right movements. TTC also dropped with more lanes and proximity to the segment end. Overall, weaving behavior became more constrained and abrupt under denser or more complex conditions, supporting field and simulation findings.
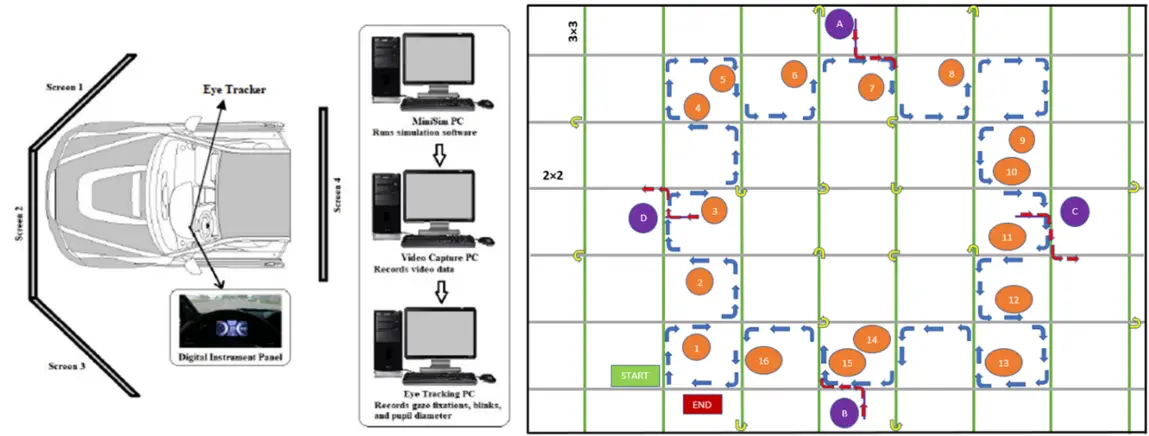
Figure 2: Layout of the KU Driving Simulator (left) and Schematic of Weaving Maneuvers Modeled in Driving Simulator (right). Source NCHRP Research Report 1094
NCHRP Research Report 1094 also carried out a safety analysis of arterial weaving configurations. Three types of safety data were gathered to examine the impact of geometric and operational conditions on arterial weaving segments: crash data from field sites, conflict data from field sites, and conflict data from a driving simulator. Crash records and traffic volumes were collected for sites across California, North Carolina, Ohio, and Texas. These data were spatially filtered using ArcGIS to focus on crashes within weaving segments, excluding intersection-related incidents. Descriptive statistics revealed notable differences in crash frequency and severity by state, with North Carolina and Ohio experiencing the highest average crashes per year. Rear-end and sideswipe collisions were the most common crash types, typically occurring at lower speeds. Analysis also showed that longer weaving lengths were generally associated with lower crash rates in California and Texas but yielded mixed results in other states.
In addition to crash analysis, vehicle conflict data—such as heavy braking (HB), time-to-collision (TTC), and post-encroachment time (PET)—were extracted from drone footage and simulator experiments. These surrogate safety metrics were processed to remove invalid or incomplete events and were assessed using consistent thresholds (e.g., ≥8.80 m/s² for HB, ≤1.5s for TTC, ≤5s for PET). Results indicated that conflict frequency and severity varied significantly across states and sites. For example, North Carolina and Texas showed an increase in heavy braking with greater weave lengths, while the opposite trend was observed in California and Ohio. Driving simulator data further supported these findings, showing TTC conflict frequencies varied by lane configuration, level of service, and direction of weaving. Overall, the combination of crash, field conflict, and simulator conflict data offered a comprehensive view of safety conditions in arterial weaving segments.
Model Development
To support the operational analysis of arterial weaving, NCHRP Research Report 1094 developed a methodology that builds upon HCM7 Chapter 18 by introducing additional steps to account for weaving-related delay. This approach remains consistent with the standard HCM procedure when weaving demand is minimal but adds a component to estimate speed reduction caused by turbulence from frequent lane changes. The method evaluates performance using travel speed, volume-to-capacity ratio, and the percentage of drivers unable to complete their weaving maneuver. It also accounts for overlapping weaving patterns and varying segment configurations. Figure 3 presents the proposed framework, which follows the HCM structure with the addition of Step 1.5 and a revised Step 2 to incorporate weaving effects.
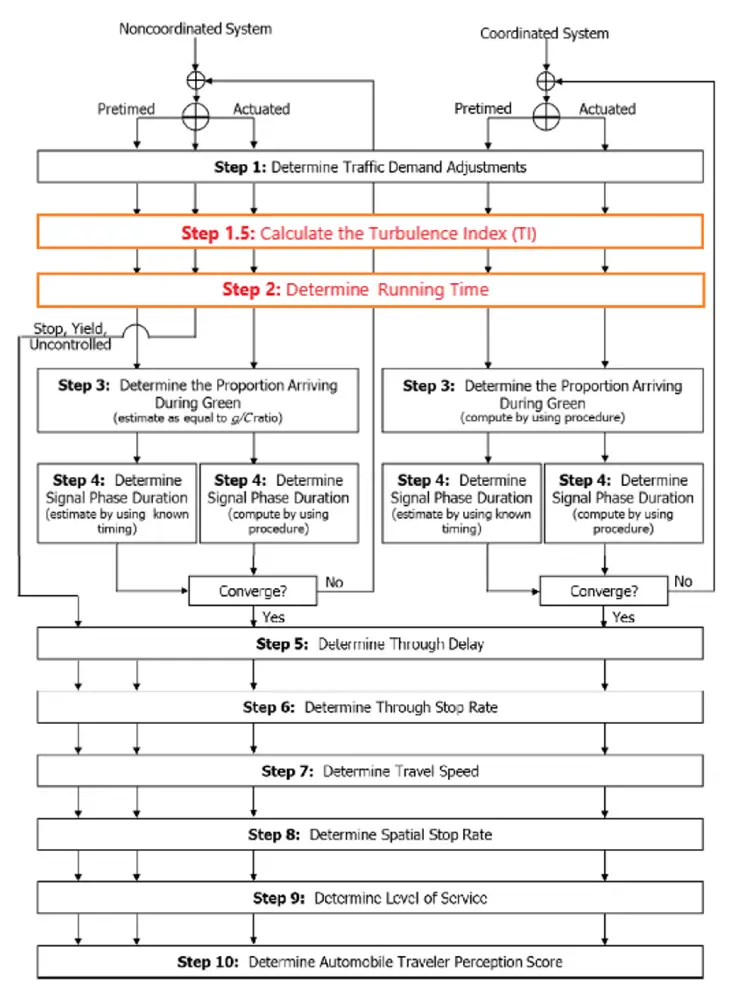
Figure 2: Motorized Vehicle Methodology for Arterial Weaving Segments (steps highlighted in red represent additions or modifications to the HCM7 method). Source NCHRP Research Report 1094
To better quantify the operational effects of weaving maneuvers, NCHRP Research Report 1094 introduced two new concepts: Potential Conflict Opportunities (PCO) and the Turbulence Index (TI). The PCO represents the potential number of interactions between conflicting traffic movements within a weaving segment, based on demand volumes and geometry. These PCOs are then used to compute the TI, which reflects the overall turbulence level caused by weaving activity and is directly tied to speed reduction and delay.
Figure 29 illustrates an example of weaving and non-weaving traffic streams and their respective conflict interactions, while Table 1 shows the formulas used to compute PCO for different weaving movements. These tools enable a more detailed analysis of traffic flow dynamics in weaving segments, especially when multiple overlapping movements exist.
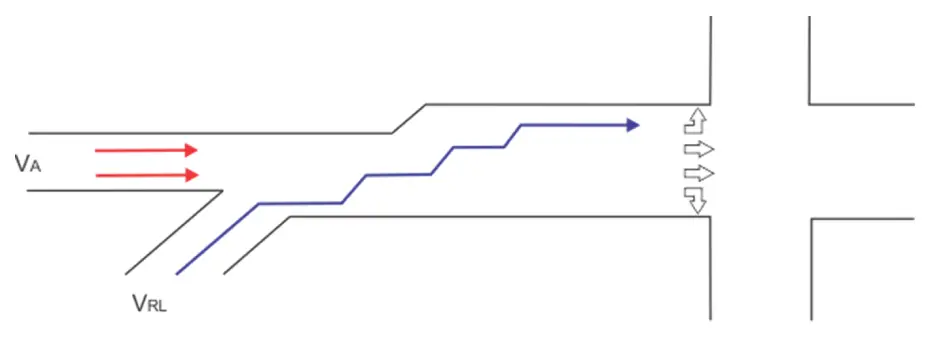
Figure 3: Illustration of Potential Conflict Opportunities for Movement VRL. Source NCHRP Research Report 1094
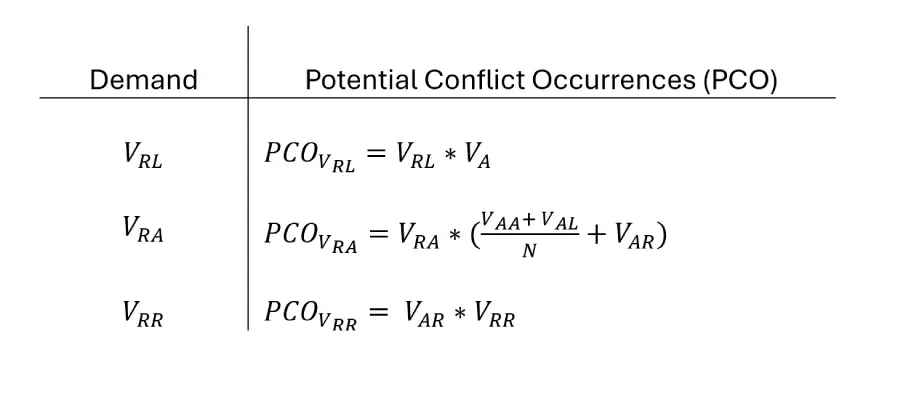
Table 1: Calculation of PCO for Example of Figure 3. Source NCHRP Research Report 1094
The NCHRP Research Report 1094 methodology extends the HCM7 framework by adding a delay component to capture the operational impact of weaving. While the base procedure aligns with HCM7 Chapter 18, additional assumptions are required due to the complexity of weaving activity across all lanes, the difficulty of isolating link and intersection delays in practice, and the potential differences in driver expectations. To maintain consistency, the methodology adopts the same LOS thresholds as HCM7.
The approach assumes that link delay occurs during the green phase and intersection delay during the red, allowing the existing HCM7 intersection procedures to remain valid. The key enhancement is the introduction of a weaving delay term, which is calculated based on the Turbulence Index (TI), traffic volume, lane configuration, and signal timing parameters.
The final running time equation incorporating weaving delay is
This equation enhances the HCM7 travel time model by capturing the additional delay introduced by weaving turbulence, allowing for more accurate performance evaluations of arterial weaving segments. As presented in Table 33, the RMSE of the model, when considering the effect of weaving, can be reduced from 9.83 mi/h to 7.00 mi/h. This substantial decrease in RMSE signifies an improvement in the model’s predictive accuracy, and the overall model error is thus deemed acceptable within the scope of this analysis.
Figure 4: Speed-flow Diagram Comparing Field Data, HCM7 and New Model. Source NCHRP Research Report 1094