
Dr. Fabio Sasahara
Providing walkable spaces for pedestrians is increasingly recognized as a critical element of urban planning and transportation design, promoting healthy communities and vibrant urban environments.
Engineers and planners seeking to improve pedestrian spaces can use the Pedestrian LOS (PLOS) methodology from Chapter 18 – Urban Street Segment Analysis from the Highway Capacity Manual (HCM). This methodology provides quantitative metrics to evaluate the comfort of pedestrians walking along an urban street segment. For a segment-based pedestrian evaluation, the HCM methodology examines the overall performance of pedestrian links (the sidewalk sections along the streets) as well as the intersections defining the segment boundaries.
This article highlights the key elements involved in evaluating LOS for pedestrians traveling along an urban street segment.
Pedestrian Spacing
One of the primary factors affecting Pedestrian LOS is pedestrian space, defined as the level of crowding experienced by individuals using sidewalks. Pedestrian space significantly impacts perceived comfort and the overall quality of walking experiences – it is a function of the effective sidewalk width, pedestrian flow rate, and walking speed.

According to HCM, pedestrian space typically influences Level of Service (LOS) negatively when sidewalks are exceptionally narrow, pedestrian volumes are excessively high, or a combination of both conditions exist. Ensuring adequate sidewalk width and managing pedestrian volumes can substantially improve pedestrian comfort and satisfaction.
Effective Sidewalk Width
The effective sidewalk width represents the available width pedestrians can use for walking, excluding obstructions, buffer widths and shy distance.
Obstructions: objects along the sidewalk reduce the available width for pedestrians. Objects have typical effective widths associated with them (refer to HCM Exhibit 24-9 for more details).
Shy distance: The buffer that pedestrians give themselves to avoid accidentally stepping off the curb, brushing against a building face, or window shopping. The HCM method applies shy distance values of 3 ft for window displays, 2 ft for building facades, and 1.5ft for a fence or low wall.
Buffer width: The distance between the outside edge of the paved roadway (or face of curb, if present) and the near edge of the sidewalk. Pedestrians will also keep a minimum shy distance of 1.5 ft from the curb, if no buffer distance is available.
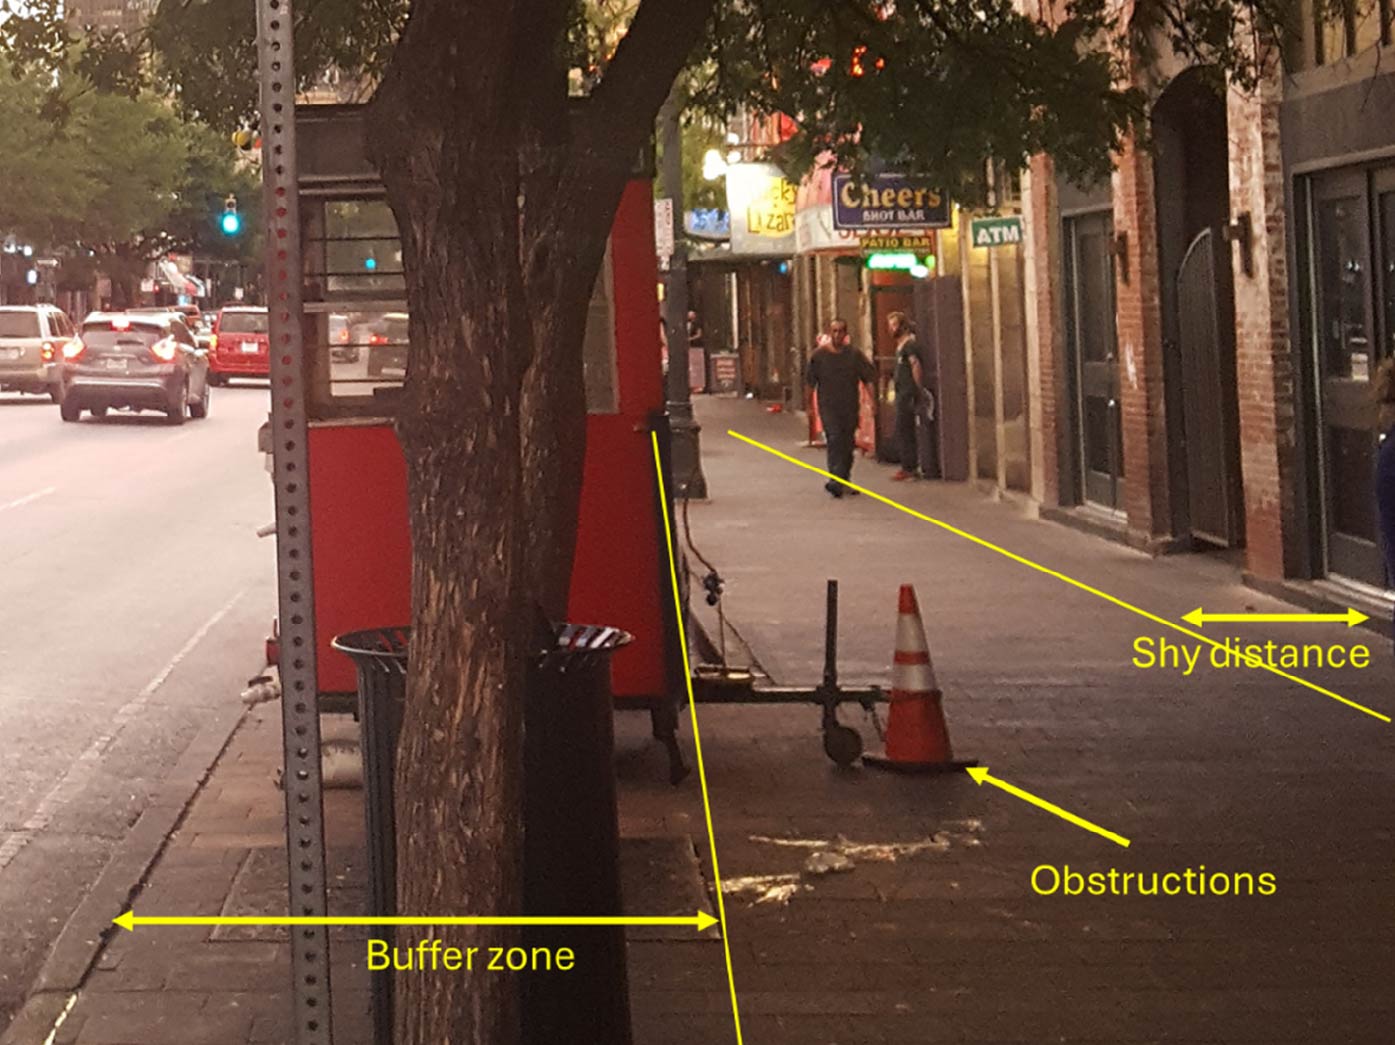
Elements affecting effective sidewalk width
Pedestrian Walking Speed

According to research, pedestrian walking speed is influenced by pedestrian age and sidewalk grade. The recommended default value for the average free-flow pedestrian walking speed in the HCM is 4.4 ft/s if less than 20% of pedestrians are elderly, or 3.3 ft/s if more than 20% of pedestrians are elderly. Additionally, an upgrade greater than 10% reduces walking speed by 0.3 ft/s.
Crossing Delay at Boundary Intersection

Additionally, the crossing delay at boundary intersections is an essential factor incorporated into the pedestrian travel time along an urban street segment. Delays at intersections directly impact pedestrian convenience, travel efficiency, and overall route attractiveness. The inclusion of intersection crossing delays provides a realistic measure of pedestrian LOS, reflecting actual pedestrian experiences more accurately.
Crossing Difficulty
Whether pedestrians are required to travel significant distances to reach intersection crossings or are forced into risky mid-block crossings due to the absence of convenient, safe crossing opportunities, their overall experience is negatively affected. Effective pedestrian design minimizes crossing difficulty by offering safe, frequent, and strategically placed crossing points.
Motorized Vehicle Traffic
Higher vehicular volumes and speeds negatively effect the Pedestrian LOS score and, therefore, are accounted for in the HCM methods.
Modeling Pedestrians on HCS Streets
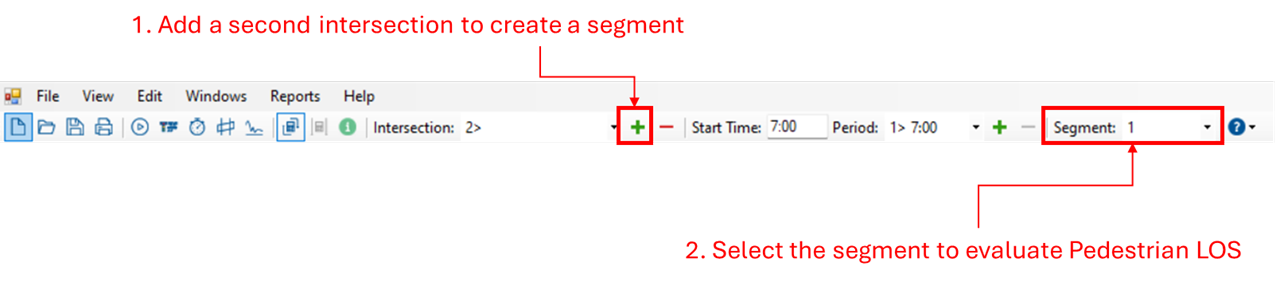
The first step for modeling in HCS is to create an urban street segment by adding at least two signalized intersections, which will define the segment boundaries:
Next, open the “Multimodal Input Data” page, then provide all necessary inputs under “Pedestrian Mode – Streets”:
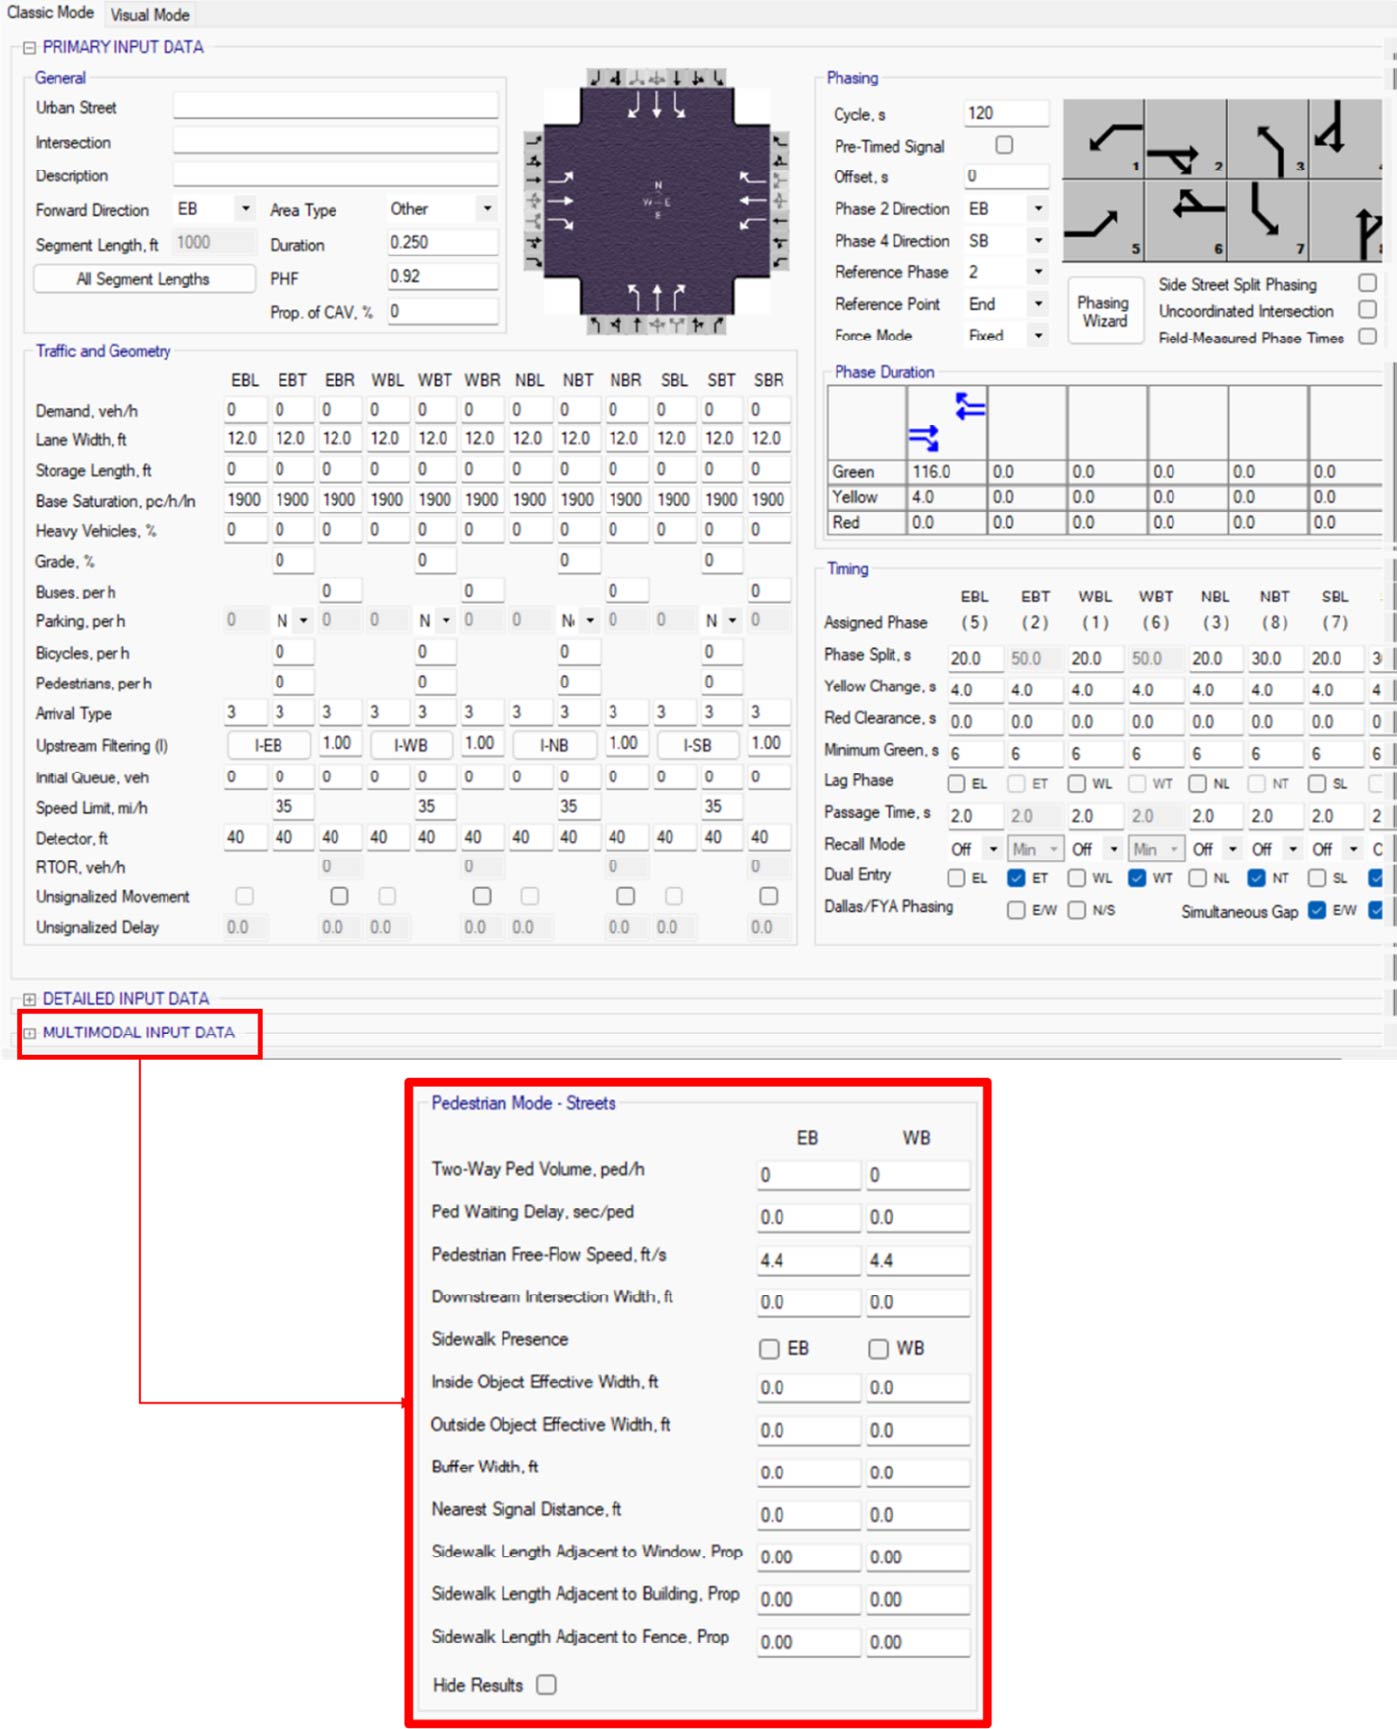
Note: make sure both boundary intersections are fully modeled, the Pedestrian LOS analysis is interdependent with the Vehicle LOS analysis at the signals.
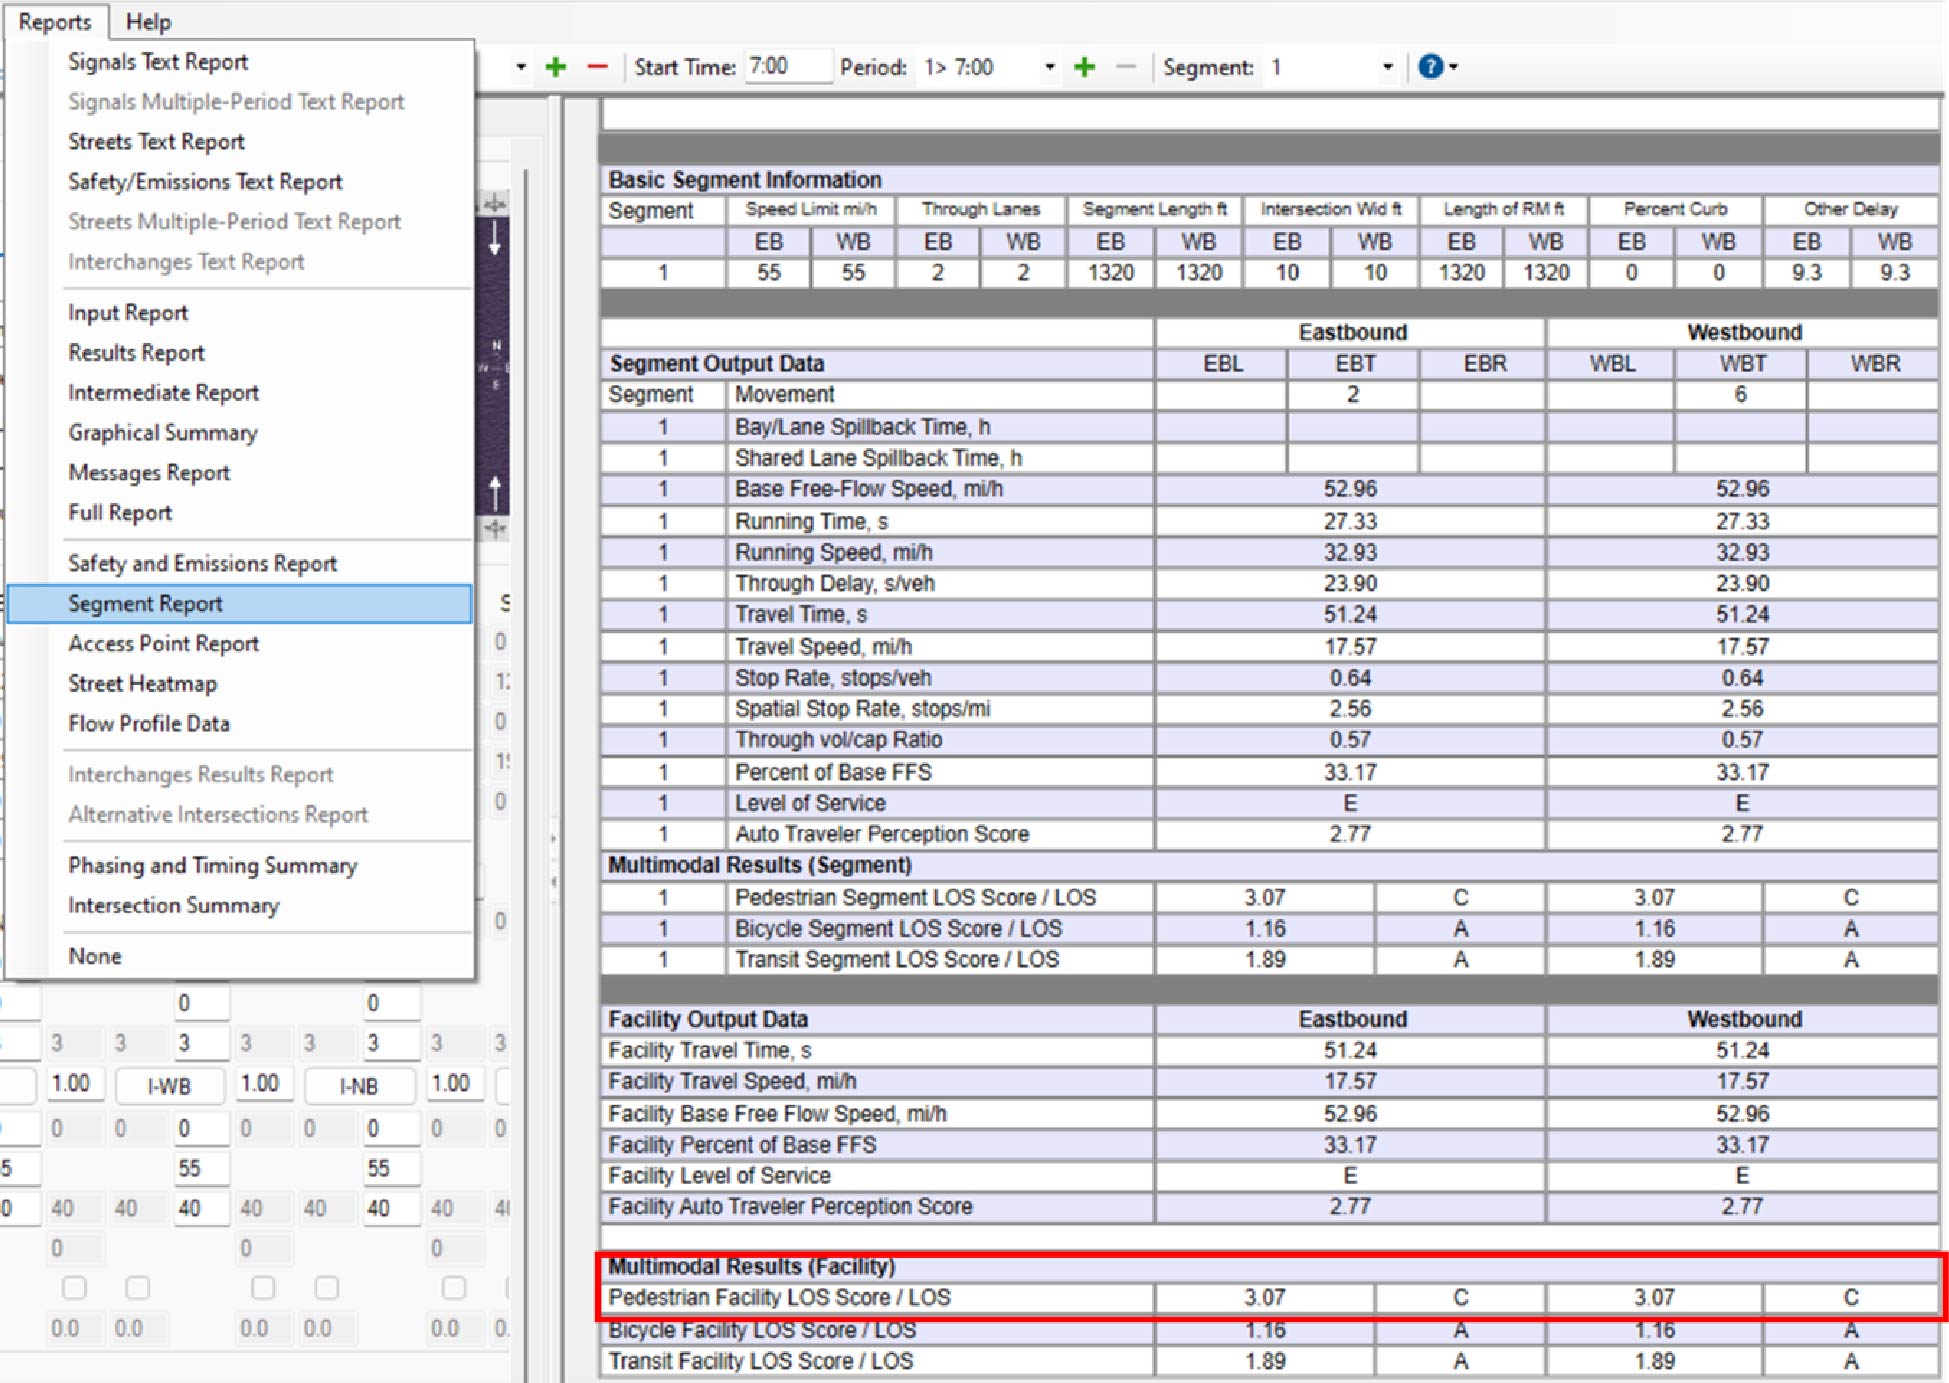
Finally, proceed to Reports -> Segment Report to obtain the PLOS measures for both directions: